From: R. G. Lyons, UNDERSTANDING DIGITAL SIGNAL PROCESSING, (Appendix F – pages 494-505.) © 1997 by Addison Wesley Longman Inc., Reproduced by permission of Addison Wesley Longman. All rights reserved.
The first step in becoming familiar with digital filters is to learn to speak the language used in the filter business. Fortunately, the vocabulary of digital filters corresponds rather well with the mother tongue used for continuous (analog) filters—so we don’t have to unlearn anything that we already know. This material is an introduction to the terminology of digital filters.
Allpass filter – an IIR filter whose magnitude response is unity over its entire frequency range, but whose phase response is variable. Allpass filters are typically appended in a cascade arrangement following a standard IIR filter, H1(z), as shown in Figure F-1.

Figure F-1 Typical use of an allpass filter.
An allpass filter, Hap(z), can be designed such that its phase response compensates for, or equalizes, the nonlinear phase response of an original IIR filter. [1]-[3] Thus the phase response of the combined filter, Hcombined (z), is more linear than the original H1(z), and this is particularly desirable in communications systems. In this context, an allpass filter is sometimes called a phase equalizer.
Attenuation – an amplitude loss, usually measured in dB, incurred by a signal after passing through a digital filter. Filter attenuation is the ratio, at a given frequency, of the signal amplitude at the output of the filter over the signal amplitude at the input of the filter, defined as
 |
(F-1) |
As is usually the case, for a given frequency, the output amplitude of the filter is smaller than the input amplitude, making the ratio in Eq. (F-1) less than one and the attenuation is a negative number.
Band Reject Filter – a filter that rejects (attenuates) one frequency band and passes both a lower and a higher frequency band. Figure F-2(a) depicts the frequency response of an ideal band reject filter. This filter type is sometimes called a notch filter.
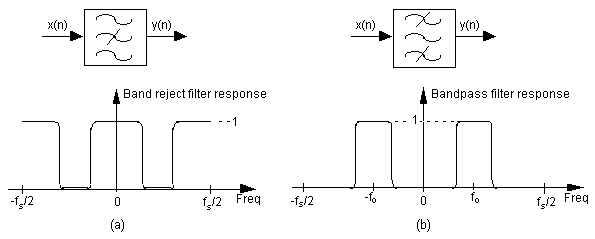
Figure F-2 Filter symbols and frequency responses: (a) Band reject filter; (b) Bandpass filter.
Bandpass Filter – A filter, as shown in Figure F-2(b), that passes one frequency band and attenuates frequencies above and below that band.
Bandwidth – few terms in signal processing have more definitions than this one. We’ll define bandwidth as the frequency width of the passband of a filter. For a low-pass filter, the bandwidth is equal to the cutoff frequency. For a bandpass filter, the bandwidth is typically defined as the frequency difference between the upper and lower -3 dB points.
Bessel Function – a mathematical function used to produce the most linear phase response of all IIR filters with no consideration of the frequency magnitude response. Specifically, filter designs based on Bessel functions have maximally constant group delay. (Modeling Bessel functions with computer software, not recommended for the faint-hearted, generally results in a significant lesson in humility.)
Butterworth Function – a mathematical function used to produce maximally flat filter magnitude responses with no consideration of phase linearity or group delay variations. Filter designs based on a Butterworth function have no amplitude ripple in either the passband or the stopband. Unfortunately, for a given filter order, Butterworth designs have the widest transition region of the most popular filter design functions.
Cascaded filters – the implementation of a filtering system where multiple individual filters are connected in series. That is, the output of one filter drives the input of the following filter as illustrated in Figure F-1.
Center Frequency (fo) – the frequency lying at the midpoint of a bandpass filter. Figure F-2(b) shows the fo center frequency of a bandpass filter.
Chebyshev Function – a mathematical function used to produce passband, or stopband, ripples constrained within fixed bounds. There are families of Chebyshev functions based on the amount of ripple such as 1 dB, 2 dB, and 3 dB of ripple. Chebyshev filters can be designed to have a frequency response with ripples in the passband and flat passbands (Chebyshev Type I), or flat passbands and ripples in the stopband (Chebyshev Type II). Chebyshev filters cannot have ripples in both the passband and the stopband. Digital filters based upon Chebyshev functions have steeper transition region roll-off but more nonlinear phase response characteristics than, say, Butterworth filters.
Coefficients – See Filter Coefficients.
Cutoff Frequency – the upper passband frequency for low-pass filters, and the lower passband frequency for highpass filters. A cutoff frequency is determined by the -3 dB point of a filter magnitude response relative to a peak passband value. Figure F-3 illustrates the fc cutoff frequency of a low-pass filter.
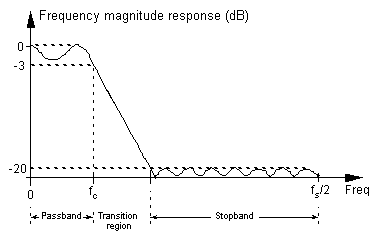
| Figure F-3 A low-pass digital filter frequency response. The stopband relative amplitude is -20 dB. |
Decibels (dB) – a logarithmic unit of attenuation, or gain, used to express the relative voltage or power between two signals. For filters we use decibels to indicate cutoff frequencies (-3 dB) and stopband signal levels (-20 dB) as illustrated in Figure F-3.
Decimation filter – a low-pass digital FIR filter whose output sample rate is less than the filter’s input sample rate. To avoid aliasing problems the output sample rate must not violate the Nyquist criteria.
Digital filter– computational process, or algorithm, transforming a discrete sequence of numbers (the input) into another discrete sequence of numbers (the output) having a modified frequency domain spectrum. Digital filtering can be in the form of a software routine operating on data stored in computer memory or can be implemented with dedicated digital hardware.
Elliptic Function– a mathematical function used to produce the sharpest roll-off for a given number of filter taps. However, filters designed using elliptic functions, also called Cauer filters, have the poorest phase linearity of the most common IIR filter design functions. The ripple in the passband and stopband are equal with elliptic filters.
Envelope Delay – See Group Delay.
Filter Coefficients – the set of constants, also called tap weights, used to multiply against delayed signal sample values within a digital filter structure. Digital filter design is an exercise in determining the filter coefficients that will yield the desired filter frequency response. For an FIR filter, the filter coefficients are, by definition, the impulse response of the filter.
Filter Order – a number describing the highest exponent in the numerator or denominator of the z-domain transfer function of a digital filter. For FIR filters, there is no denominator in the transfer function and the filter order is merely the number of taps used in the filter structure. For IIR filters, the filter order is equal to the number of delay elements in the filter structure. Generally, the larger the filter order, the better the frequency magnitude response performance of the filter.
Finite Impulse Response (FIR) Filter – defines a class of digital filters that has only zeros on the z-plane. The key implications of this are that FIR filters are always stable, and have linear phase responses (as long as the filter’s coefficients are symmetrical). For a given filter order, FIR filters have a much more gradual transition region roll-off than digital IIR filters.
Frequency Magnitude Response – a frequency domain description of how a filter interacts with input signals. The frequency magnitude response in Figure F-3 is a curve of filter attenuation (in dB) vs frequency. Associated with a filter’s magnitude response is a phase response.
Group Delay – defined as the derivative of a filter’s phase with respect to frequency, G = –D ø/D f, or the slope of a filter’s Hø(m) phase response curve. The concept of group delay deserves additional explanation beyond a simple definition. For an ideal filter, the phase will be linear and the group delay would be constant. Group delay, whose unit of measure is time in seconds, can also be thought of as the propagation time delay of the envelope of an amplitude modulated signal as it passes through a digital filter. (In this context, group delay is often called envelope delay.) Group delay distortion occurs when signals at different frequencies take different amounts of time to pass through a filter. If the group delay is denoted G, then the relationship between group delay, a D ø increment of phase, and a D f increment of frequency is
 |
(F-2) |
If we know a linear phase filter’s phase shift (D ø) in degrees/Hz, or radians/Hz, we can determine the group delay in seconds using
 |
(F-3) |
To demonstrate Eq. (F-3) and illustrate the effect of a nonlinear phase filter, let’s assume that we’ve digitized a continuous waveform comprising four frequency components defined by
| (F-4) |
That is, the x(t) input comprises the sum of a 1 Hz, 3 Hz, 5 Hz, and 7 Hz sinewaves and its discrete representation is shown in Figure F-4(a). If we applied the discrete sequence representing x(t) to the input of an ideal 4-tap linear phase low-pass digital FIR filter with a cutoff frequency of greater than 7 Hz, and whose phase shift is -0.25 radians/Hz, the filter’s output sequence would be that shown in Figure F-4(b).
Because the filter’s phase shift is -0.25 radians/Hz, Eq. (F-3) tells us that the filter’s constant group delay in seconds is
 |
(F-5) |
With a constant group delay of 0.04 seconds, the 1 Hz input sinewave is delayed at the filter output by 0.25 radians, the 3 Hz sinewave is delayed by 0.75 radians, the 5 Hz sinewave by 1.25 radians, and the 7 Hz sinewave by 1.75 radians. Notice how a linear phase (relative to frequency) filter results in an output that’s merely a time shifted version of the input as seen in Figure F-4(b). The amount of time shift is the group delay of 0.04 seconds. Figure F-4(c), on the other hand, shows the distorted output waveform if the filter’s phase was nonlinear, for whatever reason, such that the phase shift was 3.5 radians instead of the ideal 1.75 radians at 7 Hz. Notice the distortion of the beginning of the output waveform envelope in Figure F-4(c) compared to Figure F-4(b).
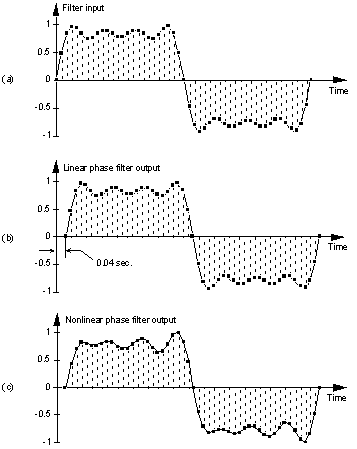
| Figure F-4 Filter time domain response examples: (a) Filter input sequence; (b) Linear-phase filter output sequencethat’s a time shifted, by 0.04 seconds, duplicate of the input sequence; (c) Distorted output sequence due to a filter with nonlinear phase. |
The point here is that if the desired information is contained in the envelope of a signal that we’re passing through a filter, we’d like that filter’s passband phase to be as linear as possible with respect to frequency. In other words, we’d prefer the filter’s group delay to vary as little as possible in the passband.
Half-band filter – a type of FIR filter where the transition region is centered at one quarter of the sampling rate, or fs/4. Specifically, the end of the passband and the beginning of the stopband are equally spaced on either side of fs/4. Half-band filters are often used in decimation filtering because (almost) half their time domain coefficients are zero. This means, for example, you can achieve the performance of an M-tap FIR filter while only paying the computational price of (M+1)/2 + 1 multiplications per filter output sample.
Highpass Filter – a filter that passes high frequencies and attenuates low frequencies as shown in Figure F-5(a).
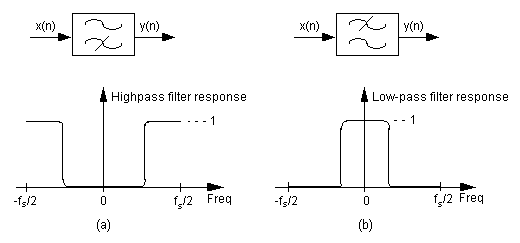
| Figure F-5 Filter symbols and frequency responses: (a) Highpass filter; (b) Low-pass filter. |
We’ve all experienced a kind of highpass filtering in our living rooms. Notice what happens when we turn up the treble control (or turn down the bass control) on our home stereo systems. The audio amplifier’s normally flat frequency response changes to a kind of analog highpass filter giving us that sharp and tinny sound as the high frequency components of the music are being accentuated.
Impulse Response – a digital filter’s time domain output sequence when the input is a single unity-valued sample (an impulse) preceded and followed by zero-valued samples. Using perhaps the most powerful principle in signal processing, we can say that a linear digital filter’s frequency domain response can be calculated by taking the discrete Fourier transform of the filter’s time domain impulse response. [4]
Infinite Impulse Response (IIR) Filter – defines a class of digital filters that may have both zeros and poles on the z-plane. As such, IIR filters are not guaranteed to be stable and almost always have nonlinear phase responses. For a given filter order (number of IIR feedback taps), IIR filters have a much steeper transition region roll-off than FIR filters.
Linear Phase Filter– a filter that exhibits a constant change in output phase angle as a function of frequency. The resultant filter phase plot vs frequency is a straight line. As such, a linear phase filter’s group delay is a constant. In order to preserve the integrity of their information-carrying signals, linear phase is an important criteria for filters used in communication systems.
Low-pass Filter– a filter that passes low frequencies and attenuates high frequencies as shown in Figure F-5(b). By way of example, we experience low-pass filtering when we turn up the bass control (or turn down the treble control) on our home stereo systems giving us that dull, muffled, sound as the low frequency components of the music are being intensified.
Notch Filter– See Band Reject Filter.
Passband – that frequency range over which a filter passes signal energy. Usually defined as the frequency range where the filter’s frequency response is equal to or greater than -3 dB, as depicted in Figure F-3.
Passband Ripple – fluctuations, or variations, in the frequency magnitude response within the passband of a filter. Passband ripple, measured in dB, is illustrated in Figure F-6. (See Ripple.)
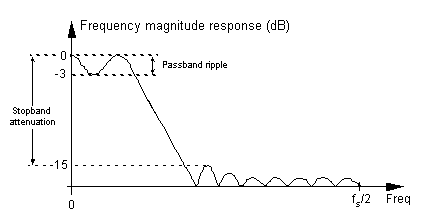
| Figure F-6 Low-pass digital filter frequency response showing passband ripple and stopband attenuation. |
Phase Response – the difference in phase, at a particular frequency, between an input sinewave and the filter’s output sinewave at that frequency. The phase response, sometimes called phase delay, is usually depicted by a curve showing the filter’s phase shift vs frequency.
Phase Wrapping – an artifact of arctangent software routines, used to calculate phase angles, that causes apparent phase discontinuities. When a true phase angle is in the range of -180o to -360o, some software routines automatically convert those angles to their equivalent positive angles in the range of 0o to +180o.
Quadrature Filter– a dual-path digital filter operating on complex signal sequence, x(n), as shown in Figure F-7. One filter operates on the in-phase i(n) data while the other filter processes the quadrature-phase q(n) signal data. Quadrature filtering is normally performed using low-pass filters on a complex sequence, i(n) + jq(n), whose spectrum has been translated down so that it’s centered about 0 Hz.
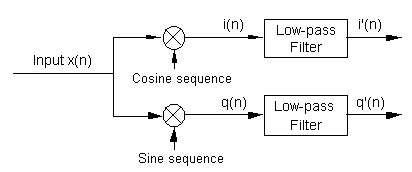
| Figure F-7 Two low-pass filters used to implement quadrature filtering. |
Relative Attenuation – attenuation measured relative to the largest magnitude value. The largest signal level (minimum attenuation) is typically assigned the reference level of 0 dB, as depicted in Figures F-3 and F-6, making all other magnitude points on a frequency response curve have negative dB values.
Ripple – has nothing, whatsoever, to do with an inexpensive alcoholic beverage. Ripple refers to fluctuations (measured in dB) in the passband, or stopband, of a filter’s frequency magnitude response curve. Elliptic and Chebyshev-based filters have equiripple characteristics in that their ripple is constant across their passbands. Bessel and Butterworth derived filters have no ripple in their passband responses. Ripples in the stopband response are sometimes called out-of-band ripple.
Rolloff – a term used to describe the steepness, or slope, of the filter response in the transition region from the passband to the stopband. A particular digital filter may be said to have a rolloff of 12 dB/octave—meaning that the first octave of a frequency fo, or 2fo, would be attenuated by 12 dB more than the filter’s attenuation at fo. The second octave, 4fo, would be attenuated by 24 dB more, and so on.
Shape Factor – a term used to quantify the steepness of a filter’s rolloff. Shape factor is normally defined as the ratio of a filter’s the passband width plus the transition region width over the passband width. The smaller the shape factor value, the steeper the filter’s roll-off. For an ideal filter with a transition region of zero width, the shape factor is unity. The term shape factor has long been used by RF folk to describe analog filters where they use the ratio of a filter’s 60 dB bandwidth over its 3 dB bandwidth.
Stopband – that band of frequencies attenuated by a digital filter. Figure F-3 shows the stopband of a low-pass filter. Although the stopband attenuation in Figure F-3 is -20 dB, not all filters have stopband lobes of equal amplitude. Figure F-6 shows that stopband attenuation is measured between the peak passband amplitude and the largest stopband lobe amplitude.
Structure – a highfalutin term used by DSP “professionals” referring to the block diagram showing how a digital filter is implemented. A recursive filter structure is one in which feedback takes place and past filter output samples are used, along with past input samples, in the calculation of the present filter output. IIR filters are almost always implemented with recursive filter structures. A nonrecursive filter structure is one in which only past input samples are used in the calculation of the present filter output. FIR filters are almost always implemented with nonrecursive filter structures.
Tap Weights – See Filter Coefficients
Tchebyschev Function – See Chebyshev.
Transfer Function – a mathematical expression of the ratio of the output of a digital filter over the input of the filter. Given the transfer function we can determine the filter’s frequency magnitude and phase responses.
Transition Region – the frequency range between the passband and the stopband of a digital filter. Figure F-3 illustrates the transition region of a low-pass filter. Transition region is sometimes called the transition band.
Transversal Filter – another name for standard FIR filter implementations, where the input samples traverse their way through the delay elements of a FIR filter.

References
[1] L. R. Rabiner and B. Gold, The Theory and Application of Digital Signal Processing, Prentice-Hall, Englewood Cliffs New Jersey, 1975, pp. 206, 273, and 288. [2] A. V. Oppenheim and R. W. Schafer, Discrete–Time Signal Processing, Prentice-Hall, Englewood Cliffs, New Jersey, 1989, pp. 236, and 441. [3] Timo I. Laakso et al., “Splitting the Unit Delay,” IEEE Signal Processing Magazine., January 1972, pp. 46. [4] John Pickerd, “Impulse-Response Testing Lets a Single Test Do the Work of Thousands,” EDN, April 27, 1995.